Last week a chart made the rounds, ranking the Presidents since Reagan on spending. Look at Reagan. That happy man is a freaking profligate. Obama, on the other hand, heck, he’s doing better than Bill Clinton.
Except there are a few problems.
First, I can’t tie this data out to the official CBO numbers.
Second, it does a bit of apples and oranges because the numbers are based on each president’s whole time in office. What does it mean when Obama increases the debt by 35% over three years, but it takes Bill Clinton almost EIGHT YEARS to increase the debt that much? A better measure would be an average per year.
Third, some have suggested this chart monkeys with the numbers, allocating the first year of each president’s first term to the previous president.
Fourth, the president isn’t the only one in Washington. Senators and Congressmen also have responsibility.
Finally, while a % increase in debt is a helpful measure, it’s not the only story. And it can be misleading if viewed on its own. For example, if we have $1 of debt, and I increase that to $10, I’ve increased our debt by 1000%. Holy Schnitzel! But if we have $500 million of debt and I increase it to $600 million, I’ve only increased it by 20%. Which is worse?
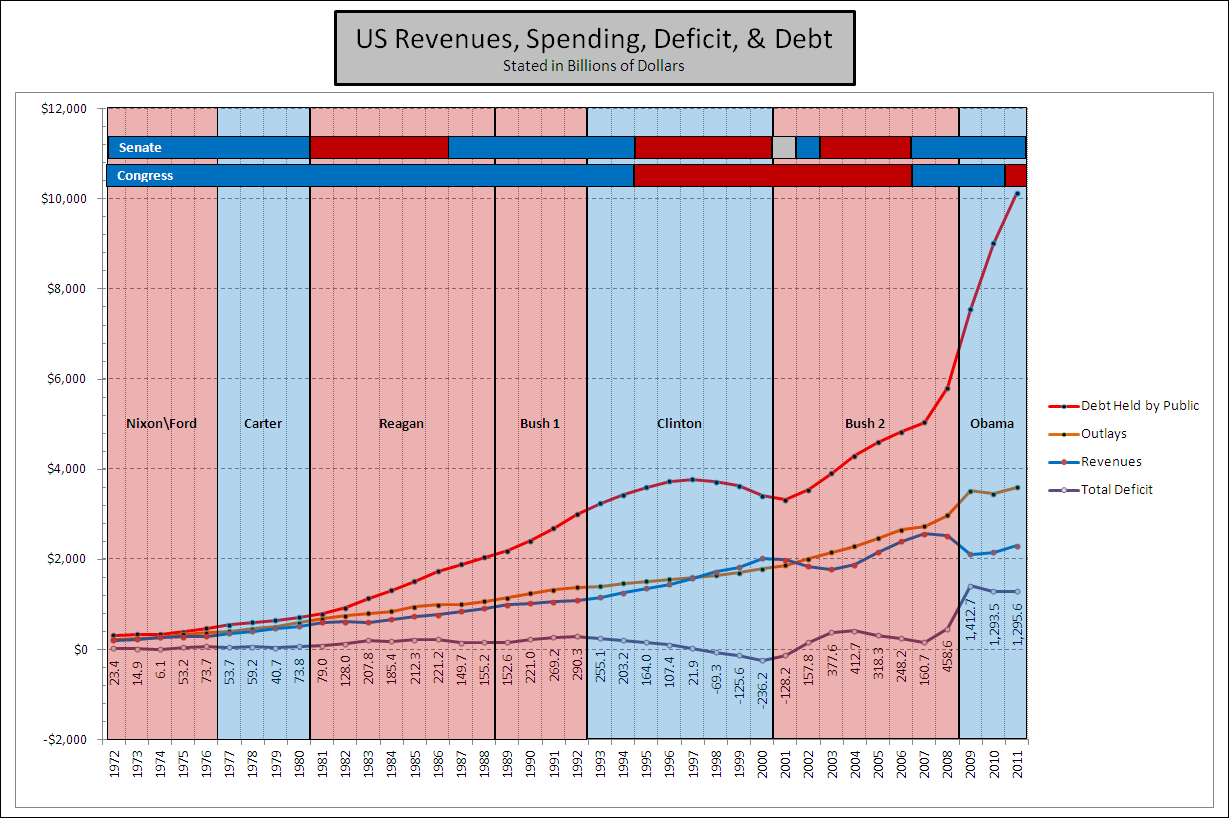
So I went out to the CBO and took their numbers from 1972 – 2011. You may get the XLS file yourself: http://www.cbo.gov/publication/42911. Then I made sure to identify who was in charge when and marked it with spiffy colors (Red is Republican, Blue is Democrat). Here are the results. Click on it to see it in its full size glory.
What does this tell us?
First, there was only ONE four-year stretch in the LAST FREAKING FORTY YEARS where the folks in Washington did not spend MORE than they took in. That was the four year period from 1998 – 2001.
What the?!?
Look at that chart again. There is a serious and systemic spending problem in Washington.
What happened in 1998 to change what had been going on for almost three decades? That was when the citizens got fed up with Washington, threw out a great number of the Senators and Congressmen, and bought into the Contract with America. This was when Newt Gingrich was Speaker of the House. This was when Clinton was getting pounded for all sorts of stuff and worked with those particular Republicans in Congress to balance the budget.
Second, the deficit, the purple line at the bottom, tripled when Obama took office. And stayed! Who put that first chart together? Oh, yeah. It was Nancy Pelosi.
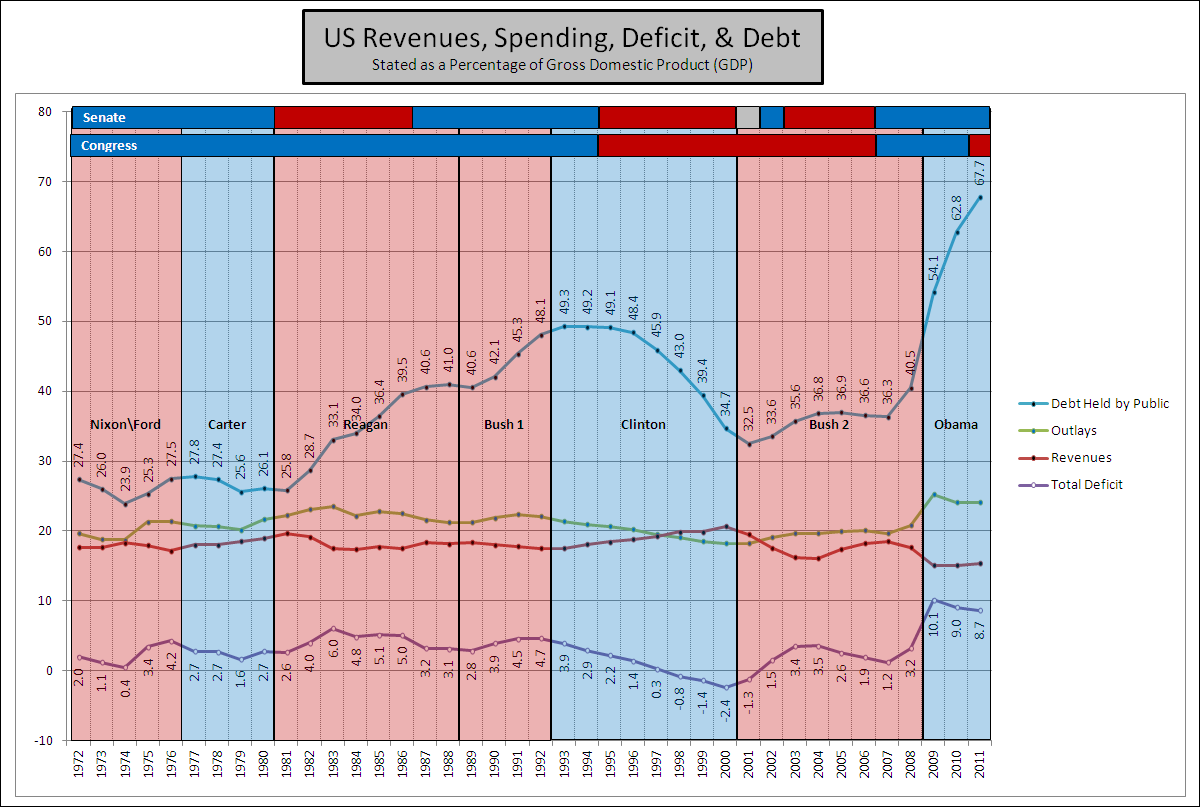
You might say, well, raw dollars is good. But what’s really important is how big a percentage that spending is of our nation’s GDP. If you’re spending 100 billion when the nation is producing 1 trillion, that sounds big, but it’s actually not as big a deal as when you’re spending 100 billion and the nation is only producing 200 billion. Okay, let’s look at these numbers as a % of GDP.
Again, 1998-2001 were good years. On a % basis, the folks in Washington during that time did better than anyone else in not spending the nation’s wealth. There’s no doubt that Reagan, Bush 1, Clinton during his fist 3 years and the Congress during those times were all happy to be big spenders. Look at the debt burden during their years. But Obama and the Democratic majorities in Congress since 2007–drunken sailors compared to those guys. And then the Republicans come in and it doesn’t change. Gridlock?
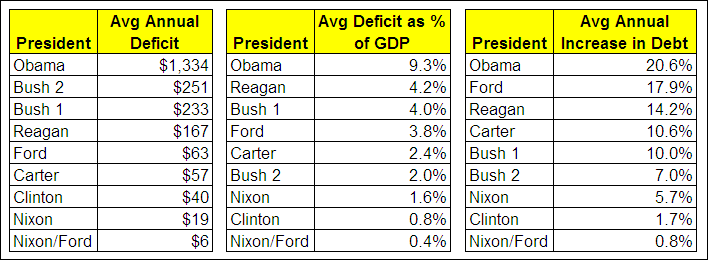
Let’s look at our presidents since 1972 and see how well they do on an annual basis. Those numbers in the first list, BTW, are stated in billions.
Seems to me the most fiscally responsible groups were those in charge during the latter part of the Clinton years, the Nixon years, and the year when Nixon resigned. It appears that during that year the folks in Washinton were so busy with the Watergate scandal they forgot to feed their spending appetites.
Bottom line: as I said before, Washington has a serious and systemic problem with over spending.
And when I say “systemic” I mean it appears the whole thing is rigged to produce over spending. We don’t just need new people out there. We need a system that prevents the overspending. We need an ammendment that requires a balanced budget and caps the size of the government in relation to GDP.
We also need to find a way to incentivize Congress to pass a budget each year. No budget, no pay is a good idea. The current House has indeed passed a budget. But the Democratic Senate has not, preventing us from having a budget at all. Obama submits budgets, but not a soul in the Senate, Democrat or Republican, will vote for them. It’s only the Republican House who seems to want to actually do their job. How can that be? Read It’s Deja Vu All Over Again with National Fiscal Policy for more info.
This November we need to get a bunch of folks like those in 1998 back in Washington. A President AND a Congress who will actually finally tame the nation’s out of control spending. Let me suggest you look at your Congressman’s and Senators’ records. How have they voted? As for President Obama, well, I’m looking at the numbers above.
Related Links
- My fab spreadsheet: HistoricalBudgetData from CBO 1972 – 2011.
- Forbes: “President Obama: The Biggest Government Spender in World History”
- MarketWatch: Obama Spending Binge Never Happened – Rex Nutting
- AEI: Upon Further Review … Yup, Obama is a Big Spender – James Pethokoukis
- IBD: Claim Obama Slowed Spending Shows Democrats’ Dishonesty
- http://en.wikipedia.org/wiki/Leaders_of_the_United_States_House_of_Representatives
- http://en.wikipedia.org/wiki/Party_leaders_of_the_United_States_Senate
- http://en.wikipedia.org/wiki/List_of_Presidents_of_the_United_States


Nice analysis, particularly the %GDP chart.
I have a simple set of rules for who I vote for:
1) Never vote for the incumbent
2) Of the remaining candidates, pick the one who has the best record of the smallest increases in government spending
3) If there is no useful record available, try to guess which candidate will be responsible for the least increase in government spending
I think if everyone followed similar rules, we would have a better (i.e., smaller) and more thrifty government.
I think with the Obamacare ruling this November is going to see one of the highest fiscal conservative turn outs in history.